What level do you think the DOW will be at in 3 months?
DOW 4500 / S&P 330 / RUA
Given the recent events unhinging the capital markets, public and shadow... I am shifting the focus of this site to cover the likely decline of the equities market to DOW 4500. Privately I have been anticipating this decline since October of 2009. It was only when the market's reaction on 4/29/2010 -- in response to the Goldman allegation's -- that I believed that a top had been put in. Given now there is heightened awareness due to the "Flash Crash" and the rapid rate that the market is unraveling there is no time to waste. Knowing this will help protect yourself and protect your assets. Ok so I've been watching this right shoulder (this is a market technical term Head and Sholders pattern which usually signals a significant decline is in process or is about to occur) form since October of 2009, and I have been patiently waiting for it to develop. Being that it was an election year I thought that it would take on the aspect of a rounded top and that it would likely move into a trading range until after the election. I also considered that the decline would happen much quicker than the left shoulder top in 2000 and the head top in 2007. However, based on the action since the Goldman civil suit was announced I have concluded that it is failing harder and faster than envisioned. In fact we are seeing the first throes of the downside now. Given the recent spate of the recent geo-political, geo-financial and geo-environmental issues it is adding lubricant to the already slippery slope of a mega downtrend.From a techinical aspect this never looked very good, from a fundemental aspect it is starting to reinforce the dire technical aspect.
In the about me profile, is the main mission... now it's about survival.
Here we are dancing above 11k on the DOW, and the talk of Golden Crosses (50 day moving average breaking through the 200 day MVA) well if it ain't Scottish it's CRRRRRAAAAAAAPPP!!!
Here is the point where the DOW 4500 20 Year Head and Shoulders is fulfilled. In my view we are at the right shoulder top right now... a double top at that!
It has been over a year that I have been tracking this one particular indicator and watching the news events track it's development. Recently this new item about banks having to stop foreclosures, because they don't have proper title is what I believe will cause the right shoulder.
It makes sense that the banks probably knew this some months ago and the folks in their houses not paying a dime have been doing the broader market a favor by buying electronics and consumer goods and saving$$$!!! This time I guess the banks can't be bailed out, so that leaves big hulking masses of debt holes that will act like economic black holes and suck everything within proximity into it's hungry MAW. Including stocks!
Politics or Selective Quotes from Ron Paul's stump speeches... I happen to agree with David Stockman, but I don't take any stock in his admission that the GOP is at fault or any party for that matter. We are hurtling now to a place of which many history books 200 hundred years from now will be focused on explaining with the hindsight of 20/20 vision.
We are so far into the weeds on this and right in the middle of the weed field it's full impact can in no way be ascertained. It's like watching a locomotive reach the end of the line at top speed with a thousand screaming passengers or a cruise ship at full steam heading for the passenger terminal.
It hasn't crashed yet, so the aftermath cannot even be fathomed. You just know that it is going to end badly and a lot of people are going to get hurt, but because it hasn't happened yet you just sit transfixed by the impending disaster about to happen. The only thing you can think at this point is that it is going to happen, you just can't envision the aftermath.
Many of us shared this moment watching the Trade Towers on fire anyone that had visited them or knew them intimately was extremely worried and heartbroken to see them on fire. However, none could have envisioned that they would have collapsed, and this is kind of where we have been and about to see play out again in our economy.
We have been vainly fighting against and at the same time watching our economy burn since 2000, but we refused to give up and fought like hell to get it under control only to see the floor collapse despite our best efforts and watched helplessly as the economy fall into itself in 2007-09. Well the next part of the collapse is about to happen and it's as I envisioned going to occur at the earliest within the next 3-6 months. This is when the pig with the lipstick, decides to put us on the menu and gives us the kiss of death. The aftermath will only start to be visible one - two years from now.
Personally I don't think you need fiscal discipline when all you have to do is to print more money, and find ways to inject it into the economy. I mean the amount of wealth that has been accumulated and stored is staggering.
The funny thing about storing mass sums of money, because there is more where that came from and sitting on it akin to watching a glacier melt. You can't see it melt but every year there are a few hundred yards less of it. It's akin to your continent of money being overrun each year by the amount of liquidity oceans of new money brings, so that your continent is now an island country.
In my humble view, it isn't not the printing of the money that is necessarily the issue. The problem is the how all the money has been distributed and accounted for thus far. Specifically the point David makes about the speculative and non-value creating ways we are able to make money these days. The trick here is when maintaining a "Token Economy System" it has to be fair and equitable or people won't want to play anymore and will stop cooperating.
I like how the article, makes a point that our deficit in 1971 was $425 Billion, but while it does mention "indirectly" that $1Trillion was our GDP it doesn't say that GDP in Q2 of this year was 14.6 Trillion while our debt was $11.8 Billion for the year. For the most part until the last eight years our debt accumulation has been in lock step with our creation of GDP. I think we have made a huge mistake eight-ten years ago, by not continuing to focus on paying down our debt. If you look at the US as a company taking on more debt is a decidely risk gamble of which never really goes well. But we are now committed.
Job recovery will never happen because technology is quickly outpacing human development and displacing more and more people. All you have to do is look at the explosion of reality shows like the Bachelorette, Survivor, MTV etc. etc. many Americans have already been displaced but the offset has been the entertainment industry. It's is still the US's biggest export, movies, music, tv shows... no one wants to watch a robot just yet, but be prepared, actors are going to be non-existent as well, relegated to people venues where you leave your house to see live entertainment.
I can't really see class warfare, because everyone in their family has a rich uncle, aunt, cousin, brother / sister no matter how unfortunate they are their own situation. Class warfare was something that happened prior to standardized testing. Wealth is not something that is only open to a family it has indiscriminately touched many lives of people from all ethnicity's and cultures, enough to offset a backlash of class fueled ire.
We will though need to undergo some aspect of social upheaval, only because change is now a constant and it is something we shall have to get used to.
Aug. 10, 2010, 12:45 a.m. EDT
Reagan insider: 'GOP destroyed U.S. economy'
Commentary: How: Gold. Tax cuts. Debts. Wars. Fat Cats. Class gap. No fiscal discipline
ARROYO GRANDE, Calif. (MarketWatch) -- "How my G.O.P. destroyed the U.S. economy." Yes, that is exactly what David Stockman
Get it? Not "destroying." The GOP has already "destroyed" the U.S. economy, setting up an "American Apocalypse."
Jobs recovery could take years
In the wake of Friday's disappointing jobs report, Neal Lipschutz and Phil Izzo discuss new predictions that it could be many years before the nation's unemployment rate reaches pre-recession levels.
Yes, Stockman is equally damning of the Democrats' Keynesian policies. But what this indictment by a party insider -- someone so close to the development of the Reaganomics ideology -- says about America, helps all of us better understand how America's toxic partisan-politics "holy war" is destroying not just the economy and capitalism, but the America dream. And unless this war stops soon, both parties will succeed in their collective death wish.
But why focus on Stockman's message? It's already lost in the 24/7 news cycle. Why? We need some introspection. Ask yourself: How did the great nation of America lose its moral compass and drift so far off course, to where our very survival is threatened?
We've arrived at a historic turning point as a nation that no longer needs outside enemies to destroy us, we are committing suicide. Democracy. Capitalism. The American dream. All dying. Why? Because of the economic decisions of the GOP the past 40 years, says this leading Reagan Republican.
Please listen with an open mind, no matter your party affiliation: This makes for a powerful history lesson, because it exposes how both parties are responsible for destroying the U.S. economy. Listen closely:
Reagan Republican: the GOP should file for bankruptcy
Stockman rushes into the ring swinging like a boxer: "If there were such a thing as Chapter 11 for politicians, the Republican push to extend the unaffordable Bush tax cuts would amount to a bankruptcy filing. The nation's public debt ... will soon reach $18 trillion." It screams "out for austerity and sacrifice." But instead, the GOP insists "that the nation's wealthiest taxpayers be spared even a three-percentage-point rate increase."
In the past 40 years Republican ideology has gone from solid principles to hype and slogans. Stockman says: "Republicans used to believe that prosperity depended upon the regular balancing of accounts -- in government, in international trade, on the ledgers of central banks and in the financial affairs of private households and businesses too."
No more. Today there's a "new catechism" that's "little more than money printing and deficit finance, vulgar Keynesianism robed in the ideological vestments of the prosperous classes" making a mockery of GOP ideals. Worse, it has resulted in "serial financial bubbles and Wall Street depredations that have crippled our economy." Yes, GOP ideals backfired, crippling our economy.
Stockman's indictment warns that the Republican party's "new policy doctrines have caused four great deformations of the national economy, and modern Republicans have turned a blind eye to each one:"
Richard Nixon's gold policies get Stockman's first assault, for defaulting "on American obligations under the 1944 Bretton Woods agreement to balance our accounts with the world." So for the past 40 years, America's been living "beyond our means as a nation" on "borrowed prosperity on an epic scale ... an outcome that Milton Friedman said could never happen when, in 1971, he persuaded President Nixon to unleash on the world paper dollars no longer redeemable in gold or other fixed monetary reserves."
Remember Friedman: "Just let the free market set currency exchange rates, he said, and trade deficits will self-correct." Friedman was wrong by trillions. And unfortunately "once relieved of the discipline of defending a fixed value for their currencies, politicians the world over were free to cheapen their money and disregard their neighbors."
And without discipline America was also encouraging "global monetary chaos as foreign central banks run their own printing presses at ever faster speeds to sop up the tidal wave of dollars coming from the Federal Reserve." Yes, the road to the coming apocalypse began with a Republican president listening to a misguided Nobel economist's advice.
Stage 2. Crushing debts from domestic excesses, war mongering
Stockman says "the second unhappy change in the American economy has been the extraordinary growth of our public debt. In 1970 it was just 40% of gross domestic product, or about $425 billion. When it reaches $18 trillion, it will be 40 times greater than in 1970." Who's to blame? Not big-spending Dems, says Stockman, but "from the Republican Party's embrace, about three decades ago, of the insidious doctrine that deficits don't matter if they result from tax cuts."
Back "in 1981, traditional Republicans supported tax cuts," but Stockman makes clear, they had to be "matched by spending cuts, to offset the way inflation was pushing many taxpayers into higher brackets and to spur investment. The Reagan administration's hastily prepared fiscal blueprint, however, was no match for the primordial forces -- the welfare state and the warfare state -- that drive the federal spending machine."
OK, stop a minute. As you absorb Stockman's indictment of how his Republican party has "destroyed the U.S. economy," you're probably asking yourself why anyone should believe a traitor to the Reagan legacy. I believe party affiliation is irrelevant here. This is a crucial subject that must be explored because it further exposes a dangerous historical trend where politics is so partisan it's having huge negative consequences.
Yes, the GOP does have a welfare-warfare state: Stockman says "the neocons were pushing the military budget skyward. And the Republicans on Capitol Hill who were supposed to cut spending, exempted from the knife most of the domestic budget -- entitlements, farm subsidies, education, water projects. But in the end it was a new cadre of ideological tax-cutters who killed the Republicans' fiscal religion."
When Fed chief Paul Volcker "crushed inflation" in the '80s we got a "solid economic rebound." But then "the new tax-cutters not only claimed victory for their supply-side strategy but hooked Republicans for good on the delusion that the economy will outgrow the deficit if plied with enough tax cuts." By 2009, they "reduced federal revenues to 15% of gross domestic product," lowest since the 1940s. Still today they're irrationally demanding an extension of those "unaffordable Bush tax cuts [that] would amount to a bankruptcy filing."
Recently Bush made matters far worse by "rarely vetoing a budget bill and engaging in two unfinanced foreign military adventures." Bush also gave in "on domestic spending cuts, signing into law $420 billion in nondefense appropriations, a 65% percent gain from the $260 billion he had inherited eight years earlier. Republicans thus joined the Democrats in a shameless embrace of a free-lunch fiscal policy." Takes two to tango.
Stockman continues pounding away: "The third ominous change in the American economy has been the vast, unproductive expansion of our financial sector." He warns that "Republicans have been oblivious to the grave danger of flooding financial markets with freely printed money and, at the same time, removing traditional restrictions on leverage and speculation." Wrong, not oblivious. Self-interested Republican loyalists like Paulson, Bernanke and Geithner knew exactly what they were doing.
They wanted the economy, markets and the government to be under the absolute control of Wall Street's too-greedy-to-fail banks. They conned Congress and the Fed into bailing out an estimated $23.7 trillion debt. Worse, they have since destroyed meaningful financial reforms. So Wall Street is now back to business as usual blowing another bigger bubble/bust cycle that will culminate in the coming "American Apocalypse."
Stockman refers to Wall Street's surviving banks as "wards of the state." Wrong, the opposite is true. Wall Street now controls Washington, and its "unproductive" trading is "extracting billions from the economy with a lot of pointless speculation in stocks, bonds, commodities and derivatives." Wall Street banks like Goldman were virtually bankrupt, would have never survived without government-guaranteed deposits and "virtually free money from the Fed's discount window to cover their bad bets."
Stage 4. New American Revolution class-warfare coming soon
Finally, thanks to Republican policies that let us "live beyond our means for decades by borrowing heavily from abroad, we have steadily sent jobs and production offshore," while at home "high-value jobs in goods production ... trade, transportation, information technology and the professions shrunk by 12% to 68 million from 77 million."
As the apocalypse draws near, Stockman sees a class-rebellion, a new revolution, a war against greed and the wealthy. Soon. The trigger will be the growing gap between economic classes: No wonder "that during the last bubble (from 2002 to 2006) the top 1% of Americans -- paid mainly from the Wall Street casino -- received two-thirds of the gain in national income, while the bottom 90% -- mainly dependent on Main Street's shrinking economy -- got only 12%. This growing wealth gap is not the market's fault. It's the decaying fruit of bad economic policy."
Get it? The decaying fruit of the GOP's bad economic policies is destroying our economy.
Warning: this black swan won't be pretty, will shock, soon
His bottom line: "The day of national reckoning has arrived. We will not have a conventional business recovery now, but rather a long hangover of debt liquidation and downsizing ... it's a pity that the modern Republican party offers the American people an irrelevant platform of recycled Keynesianism when the old approach -- balanced budgets, sound money and financial discipline -- is needed more than ever."
Wrong: There are far bigger things to "pity."
First, that most Americans, 300 million, are helpless, will do nothing, sit in the bleachers passively watching this deadly partisan game like it's just another TV reality show.
Second, that, unfortunately, politicians are so deep-in-the-pockets of the Wall Street conspiracy that controls Washington they are helpless and blind.
And third, there's a depressing sense that Stockman will be dismissed as a traitor, his message lost in the 24/7 news cycle ... until the final apocalyptic event, an unpredictable black swan triggers another, bigger global meltdown, followed by a long Great Depression II and a historic class war.
So be prepared, it will hit soon, when you least expect.
Well, at this level we could expect follow through to 10,200 up to 10,300 as a this minuscule relief rally forces shorts to take some profits. It will be interesting once Europe vacations start up how the market will react. 10,138 as evidenced by the chart is a critical level where that and the aforementioned levels represent huge confluence Fibonacci levels. I would keep watching the European and IMF statements about the dollar, as there have been major efforts to talk down the dollar in the past month, as remarked upon in my Token vs. Economy articles.
As far status on the massive 20 head and shoulders of which we are at week 10 since the Goldman Top, we are still on target, for DOW 4500. I continue to be an advocate of selling all rallies, as the economy still has a significant of gravity pulling it down. 10,197 is a minor Fibonacci retracement line, however being that this is a monthly chart it is still pretty significant.
Is it different this time they ask? This article is mainly what I have been writing about since April, 2010 and believing since 2001. This just kind of creeps up on you until you end up like the guy in Stephen Kings novel Creep Show as a pile of vegetated matter. The action governments need to take is devaluation of currency. The first one to bite it will likely cause a domino effect the scale and rapidity of such will make your head spin. Don't get lulled, by the almost making it back up in the market. Get your 401k your money out, and buy a farm or Rhodium.
Is It Different This Time?
AFP/Getty Images
The U.S. Federal reserve building.
The evidence is accumulating that the U.S. economy is heading into a double dip, if it isn’t there already.
Sure, the various red flags could be wrong; it could be different this time. But the weight of probability is definitely on the downside.
The importance of the fiscal and monetary infusions following the credit crunch are becoming clear. The 11% deficit relative to GDP the U.S. government ran during 2009 managed to generate only around 2.5% GDP growth in the year to the end of the first quarter. This pales next to the rebounds that followed previous economic revivals.
Zero interest rates and quantitative easing worth around another two percentage points off the Fed funds rate have done all they can.
The current stimulus program is starting to wind down, so the net effect of new spending is tailing off. This has already become painfully apparent in the housing market, where the ending of buyer tax credits has seen housing sales numbers fall off a cliff to register even lower lows than anyone thought possible.
What’s more, it looks clear the inventory cycle rebuild is also beginning to run out of steam. And that’s important. Inventories generated around two-thirds of U.S. growth last year. By contrast, real final sales have been running at a mere 1.2%, the lowest for the year following the end of a recession in least 50 years, according to David Rosenberg of Gluskin Sheff.
Regional Federal Reserve bank surveys of business activity point to a slowdown, all during a period when employment growth seems to have stagnated.
No wonder longer-dated Treasury bond yields have tumbled, to where the curve is beginning to look uncannily like Japan’s did in the early stages of its lost decades–before, that is, the JGB curve turned completely flat.
As glum as the domestic picture looks, the international one is looking downright depressing. European austerity will not only limit U.S. exports to the region, but the euro zone will undoubtedly also look to the U.S. market to trade its way out of trouble. Meanwhile, the Chinese economy looks increasingly unhinged. Should its domestic real-estate bubble burst, you can expect China to look to ramping up its exports to the U.S. as a way of mitigating the pain.
John Hussman, of Hussman Funds, reckons the evidence suggests “the U.S. economy is most probably either in, or immediately entering, a second phase of contraction.”
Given the growing popular resistance to yet more fiscal stimulus–some policymakers are worried about triggering a sovereign-debt crisis in the U.S., while a vocal body of voters doesn’t want an even bigger government–the burden will fall on the Federal Reserve to get the U.S. economy out of trouble. Andrew Roberts, head of credit at Royal Bank of Scotland, figures the Fed will start a flood of QE.
History shows this seldom ends well. Kenneth Rogoff and Carmen Reinhart’s instant classic tome on debt crises, “This Time Is Different”, shows that banking defaults tend to be followed by sovereign defaults that tend to be followed by emergency monetary responses that result in uncontrolled inflation.
Paul Krugman warns that if governments don’t act, the global economy is heading towards its third serious depression of the past century and a half. And yet, if they act too much, they’ll destroy the very cornerstone of modern economies, government-issued currency.
Copyright 2008 Dow Jones & Company, Inc. All Rights Reserved
This copy is for your personal, non-commercial use only. Distribution and use of this material are governed by our Subscriber Agreement and by copyright law. For non-personal use or to order multiple copies, please contact Dow Jones Reprints at 1-800-843-0008 or visit www.djreprints.com
The share and dollar volume on selling is just huge, about half of what it was on Friday, but still very heavy. This step doesn't feel done although the TRIN ending the day at 2.0 makes it easier to have a pop early tomorrow, but I doubt it will last.
Here is that monthly Russell 3000 chart with the big ol' Head and Shoulders pattern thirteen years, there is an additional H&S on the same chart daily from December also confrimed. This still looks so nasty. Be careful and don't overstay your welcome.
See Yesterday's Chart O' The Day for the UUP, chart...
What if we drilled down on the 1929-1933 $DJI Era what would we see?
Well the Gestalt view (looking at the whole) last 7 plus decades, probably not much, but when you look at the period of 1929-1933 you have to ask yourself does this relate to our current situation?
Are we at the beginning or the end? Is 2010 = 1931 or is it = 1937? My hunch is that this is more like 1931.
The market at that time was equivalent to a 37 story building (10ft=1 Story). FYI, the tallest building at the at that time was 48 stories (The NY Mercantile).
A fall of a 37 story building was just as deadly as it is today, except the buildings being built today are well in excess of 100 stories, one of the the tallest buildings being planned is in excess of 160 stories. Yes you guessed it.... in Dubai! I guess the extra stories gives you more time to think about how you got to where you were and where you are going.
Wow is all I can say... I got a baaaaaaaaaaaaadd feeling about this...
Oh and here is the PC Ration and volumes as of 2:19:46 PM EST, this just saying go short. BTW, this is courtesy of TOS Platform. It rocks!
Here is the closing picture for today 5 stocks in the S&P 500 finished up! The PC Ratio below tells the story as does the $ and trade volume. I can't imagine any investor wanting to be playing in this, I have to think even big investors are also getting leery. Today I think I heard some necks snapping and backs breaking as any hedge funds that might have had a chance to live after May no just got their throats stomped.
I can't believe Larry Fink and Barton Biggs came out bullish! They aren't looking too smart right now. Here is the above to snap shots again, after market close. YUCK!
PC/Ratio of .28 on advancing stocks... WOW! Over 1.601 on declining stocks. This just screams short on Monday too!
I just wanted to bring this to your attention. A nice head and shoulders on the daily $SPX, $DJI and $RUA looks like it is close to completing the right shoulder. This pattern has been in development since December 2009, clearly this pattern should give anyone special heed if you are considering buying into these bargains.
This H&S pattern is encapsulated witihn the 20 year pattern I have been writing about extensively.
If you subscribed to my Aimed Daily Market Forecast or Aimed Bi-Monthly Market Forecast you would have known about the potentiality of it 24 hours ago. Check out the William Tell TradeCraft store for details, just click the June 1 bi-monhtly report image.
Todays action looks to have made this right shoulder a done deal, definately bad news for Monday-Next week, unless something extraordinarily positive happens...
It's possible this could still head up, but it actually double topped, so I 'd say it's a goner. Especially since the the DOW dropped 150 at the open. Maybe a success story out of the Gulf will stem the bleeding, but even that may not be enough good news.
The $RUA is sans Fibonacci lines... Each chart looks the same there is no escaping this Large Cap, Small Cap, Micro Cap, it just doesn't matter.
The hedgies took a bit of a hair cut in May, and these are the top guys (rockstars), I am even surprised at the size of the drawdown in May, 6.9% in Paulson's case! I expected a bit of bad news on hedgie returns, but this is worse than even I thought.
Note to the curious check the market sentiment indicator on the $DJI 10 year, but if you look at the monthly in post above it is decidedly bearish. This indicates that their is still a lot of fight left in the bulls.
However, if you look at the market sentiment on a daily basis... the worm has definately turned my friend! The resistance is at $DJI is 10,232.33, with the next major support level at 9,361.
Here is the $SPX for good measure... resistance at 1,117.91-1,190.89; major support 1,066- 1,030.
I was inspired to write this article by the flaming punch; counter punch exchange between Market Ticker (aka Karl Denninger) and Gordon Gekko (aka apparently we don't know). Have a look for yourself here Gordon Gekko On Denninger and here Denninger On Gekko . Good points were made on both sides, but I'm predis positioned to err on the side of Market-Ticker's view. I looked at the Gold piece in depth a few months ago before I even had a thought about launching and writing a blog, of which this analysis was used in my article published on Seeking Alpha On Our Token Economy.
My view on Gold was that all it would take is for someone to announce that they had figured out a way to turn Lead into Gold and the market would go down like a lead balloon. By the way you can turn lead into Gold, it was accomplished way back in the 50's and again later unintentionally by the Russians in the 70's.
Transmutation of lead into gold isn't just theoretically possible - it has been achieved! There are reports that Glenn Seaborg, 1951 Nobel Laureate in Chemistry, succeeded in transmuting a minute quantity of lead (possibly en route from bismuth, in 1980) into gold. There is an earlier report (1972) in which Soviet physicists at a nuclear research facility near Lake Baikal in Siberia accidentally discovered a reaction for turning lead into gold when they found the lead shielding of an experimental reactor had changed to gold. Turn Lead Into Gold
I suspect the techniques have gotten better and the cost has gone down significantly and or with the run up in Gold is more cost effective. I continue my assertion that as long as Gold goes up so will the value of the dollar, mainly because the US has the largest Gold reserves in the world. Another observation from that article was to point out that Portugal had surprisingly larger Gold reserves than the UK and likely made a better credit risk than did the UK. This was primarily due to the UK selling nearly or nearly half (415 Tonnes) of it's Gold reserves in 1999 at an average price of $276 an ounce.
Apparently this was at a low that is affectionately referred to as "The Brown Bottom" after the then Exchequer of the British Treasury (Then Gordon Brown) decided to sell UK Gold for a pittance. In what appears to be just irony too good to be true, Nick Leeson of Barings Bank fame gets to comment on this particular trade and compare Browns 6.6 Billion Pound loss with his $1.3 Billion loss. You have to think that Brown conveniently excoriated Leeson on his trade, and probably rode Leeson's hide all the way up to the role of Exchequer, only to have done an even worse trade, threatening a whole Commonwealth. For their efforts Leeson went to jail and Brown became Prime Minister of Britain!
OK so this is all well and good, so now we have gone from the "Brown Bottom" to the "Gold-Man Top" so now what? Is Gold a better play, well I think what happens is the price run up will create the demand which we have seen which will continue until supply can catch up.
A perfect case study is when the Hunt Brothers attempted to corner the Silver market and they were done in by Dr. Jarecki of Falconwood Corporation, aka. Gresham Investments fame, as the principle counter party to the Hunt Brothers trade. Here it is described in his own words.
“As the price of silver over very few months rose from $7 to $17 and then to $30, 40, and 50, the American public took its rings off, sold its silverware, and some even took their silver teeth out of their mouths. People lined up, two hundred deep, to sell silver. The smart people laughed at them. The market price of silver was $50 and the yokels were selling it for $30 to the scrap dealers who were selling it to the bullion dealers for $40 who were hedging it in the futures markets at $50. But when these billions of dollars worth of new silver got refined and came on the market and the Hunts, in an effort to keep the supply-induced price drop from causing margin calls that would bankrupt them, had to buy it up, the corner failed. It was not by an act of the Federal Government, but because the market itself corrected the imbalance between supply and demand and thus ultimately bankrupted the Hunts. It is here worth mentioning, of course, that it was the little guy who made the big profit and that it was he, through the market, that foiled the Hunts’ attempt.”
This posting is also worth checking out if you also want to consider the effect of recent alleged market manipulation of the world gold and silver bullion markets, by two large banks. Bullion Market Manipulation
This aspect of Gold as a hedge and the idea of it being thought of as a "Disaster Hedge" which it isn't really as I pointed out in as referenced here What the Rebound In The Art Market Signals got me to thinking well if Gold is the rube trade? Then where is the real precious metals trade?
This question led me to discover the Rhodium Rodeo... What is Rhodium?
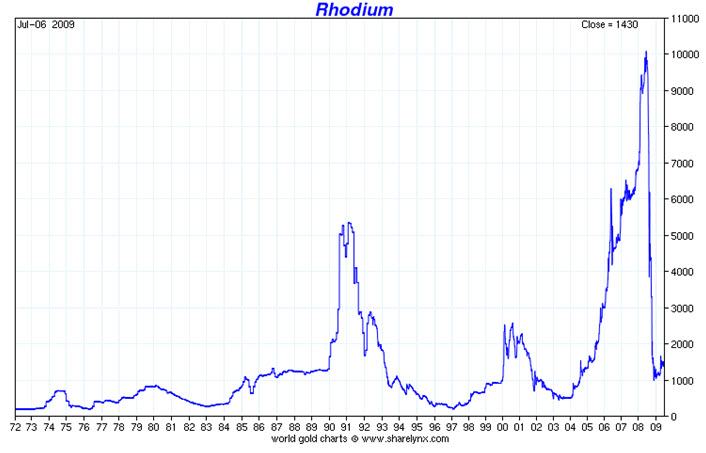
To summarize, Rhodium, is likely THE rarest precious metal you can find in existence. It's current price is roughly $2,635 per Troy ounce as of May28th, and since it isn't and exchange traded commodity you basically have to own it to have it. Interestingly enough Rhodium, is also a by product of spent nuclear fuel and generally produces 400g of Rhodium per ton of spent fuel. The half-life of the radioactivity in the Rhodium is less than a year or in some isotopes and not more than 20 years in others, but it still is a relatively expensive process to reclaim. However, what is so remarkable about Rhodium was the price it was at in the Summer of 2008 when it was at a high of $10,010.00 per Troy Ounce. This was from a standing start of $533 an ounce in 1979 and a breakneck jump from $2000 in 2005. Back to a low of $760 an ounce in January of 2009. Talk about "buy and hose"!
The natural demand for Rhodium is in the manufacture of automobile catalytic converters. In fact 81% of the world production of Rhodium in 2007 went to this use. If you look at the USDOC finding below you see an astounding revelation that the Rhodium in your cat converter, if you bought a car in 2007-8 the 1/8 of an ounce Rhodium added $1,200 in cost to the price of your car! Don't even think about the 15-20% cost added by adhering to Emission Standards which was another surprising revelation.
"The US Department of Commerce has estimated, according to a 2008 report titled "Increase in Vehicle Cost Due to Implementation of Emission Standards"[citation needed], that catalytic converters add as much as $1200 on to the sticker price of a vehicle. The same report also stated that EPA required equipment, including catalytic converters, cost somewhere between 15% to 20% of the sticker price of a new vehicle. As an example, if the MSRP of a vehicle is $20,000 then 20% ($4000) of the MSRP price is due to EPA emission standards. Not only is there a rise in the cost of a purchase of a new vehicle, but also an increase in the cost of gasoline over the life time of the car. Catalytic converters limit the airflow of exhaust through the exhaust system making the system less fuel efficient. The EPA has estimated the loss of fuel efficiency by 5% per gallon. That is, a vehicle burns 5% more fuel to travel the same distance with a converter than it would without."Catalytic Converter"
So when the car market hit a wall Rhodium got ejected over the wall and off a cliff. Funny enough not even the dust up between Russia(Second largest producer of Rhodium, 1of3) and Georgia couldn't put rhodium back together again, as that all transpired in August 2008 while Rhodium was well into it's cliff dive.
Oh and what a beautiful dive it was. The drop off is astounding, and no splash even. Even more astounding when you factor in the time frame which was pretty much the height of the equity market down trend which also failed to break its fall.
OK so Bold Gold, The Rhodium Rodeo, where does Cash for Clunkers fit in?
Well I left you a teaser in the discussion about Rhodium and its use in the catalytic converters of cars. Of the total 2007 production of Rhodium 22 tons of it was mined and 6 tons was recycled or reclaimed, mainly from the recycling of catalytic converters.
When you consider that the "Cash For Clunkers" program was derided as a huge waste of money you have to consider the genius of the idea, and possibly why it didn't cost nearly as much as we thought it did. The fact that it took less fuel efficient cars off the road, and provided a big shot in the arm for the auto manufacturer's. Not only because it created a short demand spike.
You have to consider that the Rhodium, Platinum and Palladium held within those cars made the program half as expensive, and twice as effective. Generally because the dealers benefited from the scrap money, the recyclers benefited from the metal recovery and the automakers benefited from the lower prices of these metals as the market after being crushed was held back from running up again to because of a brand new supply of reclaimed precious Rhodium.
I thought it curious that the program could care less about cars more than 25 years old, the ones you would think have the most inefficient engines and most pollution, but it was really all of the cars with old catalytic converters the US Government was really interested in.
But wait there's more! Remember the 15-20% added cost of a car to keep emission standards, that part doesn't include the cost of 5% extra fuel consumption that the old cars had as a result of having catalytic converters in the first place. Originally the program was targeting 250k cars off the road, by the end of the program they had succeeded in taking off 678k "Gas Guzzling" cars off the road. At a cost of $2.854 Billion, however, when you factor the fall in prices of precious metals due to reclaiming precious metals from old catalytic converters and the collapse in the market for Rhodium the Auto industry benefited hugely.
The National Highway Traffic Safety Administration (NHTSA) also released the final eligibility requirements to participate in the program. Under the CARS program, consumers receive a $3,500 or $4,500 discount from a car dealer when they trade in their old vehicle and purchase or lease a new, qualifying vehicle. In order to be eligible for the program, the trade-in passenger vehicle must: be manufactured less than 25 years before the date it is traded in; have a combined city/highway fuel economy of 18 miles per gallon or less; be in drivable condition; and be continuously insured and registered to the same owner for the full year before the trade-in. Transactions must be made between now and November 1, 2009 or until the money runs out.
I'm guessing the cars today are much more efficient with gas and have mitigated a lot of the fuel consumption issues introduced when catalytic converters were just introduced. I suspect as well that the process for using Rhodium in cat converters requires a less of Rhodium than it did even several years ago. So this was clearly a net net gain.
But wait there's more... Russia at 14% of world supply (S. Africa is 82%) was suspected to be intentionally and artificially lowering the supply for these precious metals there by increasing the price, it is clear that Rhodium was in a swoon at this point but what isn't clear is why did it fall lower. Like to less than $800 from $10,000… perhaps we had Russia in the throes of their financial worries dumping there stockpiles on the market. This could happen to any commodity, and it does.
Things to worry about with the gold trade...
The IMF in September made a big announcement about the intention to sell about 400 tonnes of it's gold reserves of which India(200 Tonnes, Sri-Lanka (10 Tonnes) and Mauritania (2 Tonnes) leaving approximately 191 Tonnes left to sell. The question is to whom are they going to sell it too? The only entities capable of taking this amount are the Central Banks and none of them are running to do so. So I guess this means that if their aren't any Buyers the only thing left are sellers.
Indeed- as promised in yesterday's post- we were hoping today, to highlight the positive angle via which the WGC viewed last year's slowdown in central bank gold disposals. In its Gold Demand Trends publication, the organization spoke of the supply of gold from the official sector as: "all but [having] dried up during 2009. Net sales of 44 tonnes compared with sales of 236 tonnes the previous year and an annual average of 444 tonnes over the five years to 2008. The net sales were wholly concentrated in the first quarter of 2009, which was followed by three subsequent quarters of net purchasing, albeit at very modest levels. Sales of gold under the auspices of the Central Bank Gold Agreement (CBGA) were virtually non-existent during the fourth quarter, amounting to less than 2 tonnes. Gold Prices Down On IMF Sale
The Gold market is so exposed to the Central Banks, the very entities for which we owe the rich re-birth of gold prices can easily commit patricide, and kill it. I also ask if the demand is so high for Gold why isn't anyone stepping up to take the last 191 tons of it off the IMF's hands?
In closing Rhodium is by far a better disaster trade as it the most rarest of the precious metals, and as a disaster hedge is ounce for ounce a better store of value, but why did it at the height of the market uncertainty in 2008 and again in 2009 fail? I guess you could make the argument for it being highly illiquid as one of the reasons, but you don't keep it as a trade you keep it as insurance. This is trouble with precious metals as a whole, it's volatile temperamental and no sure thing.
One thing to note, the annual production of Rhodium is 1% of Gold, yet its price is only about 50% more than Gold so if you are looking for a good disaster hedge, consider this. No one knows about it and it is really under the radar, and it's rarer than Gold. Rhodium is once again on the move how much is attributed to the rebound in the car market vs. the disaster hedge alternative is up for analysis, but no doubt it is on the move and should be watched carefully or even owned.
Gee another down day, it'll not be too much longer before the Bulls DUCK and RUN...
One thing I have been patiently waiting on is the fall out from this month's slide and impact -- almost certain -- to hedge funds from that near fatal whiplash hit from the "fLash Crash" (Not a Typo). Keep your eye on the Hedge Fund Implodes in June it'll likely start to heat up as the redemptions start coming in if it hasn't already.
In my last post John Henry vs The Steam Shovel, hedge funds were likely unwinding a good portion of their trades in mid-March and again in mid-April, whether they were the ones responsible for the May 6h carnage is up for debate. Either they were the initial cause or they got caught flatfooted, in any case I suspect they started to accelerate their selling since, perhaps in anticipation of massive redemption requests.
Fortunately for the market the hedgies could sell to the folks fleeing the carnage in Europe and the Euro, although their selling and the institutional selling in May quickly stunted that inflow into the US markets.
One thing that will be different than last years' breakdown is the manner of selling by hedgies. Remember all of the current hedge fund agreements with investors were revised post March 2009, and are fundementally different. Nearly all the hedge funds changed their agreements with investors to require 90 days notice of redemptions and gates of only 25% of the investors money per month/quarter. How this affect the hedgies and their holdings is not certain, but you can bet the next 30-60-90 days will likely be a great deal of them dumping their portfolios and moving to Cash?.?
I still expecting the DOW to rally into the end on May at least up to the 10,262-363 level, but given today's action, likely hedge fund redemption risk and North Korea's proclivities, we may not get back above 10,088. Ouch!
One thing for certain is that the right shoulder has been made confirmed as it broke the February 11th low. It is inconceivable, but not out of the realm of possibilities that it could retrace this long Black/Red candle, and resume it's upward trend.
The more I think of the "flash crash" the more it brings to mind this quote from Vernor Vinge.
"Within thirty years, we will have the technological means to create superhuman intelligence. Shortly after, the human era will be ended. ”
— "The Coming Technological Singularity" by Vernor Vinge, 1993
What he was describing was "the singularity", the point in time where machine or computer thought will surpass human thought. He based it on Moore's Law -- which states that the number of transistors that can fit on a chip would double roughly every 18-24 months -- extrapolating from there to suggest that in thirty years time the processing power of a microchip might be equal to or exceed that of the human brain. Technical singularity is akin to Vinges' prophecy but based on the advance of technology, to the point where better technology -- sans humans -- can create even better technology a recursive scenario. Yes... exactly like the movie iRobot.
"Technological singularity refers to a prediction in Futurology that technological progress will become extremely fast, and consequently will make the future (after the technological singularity) unpredictable and qualitatively different from today. It is most often associated with the ideas of futurist Ray Kurzweil.[citation needed] http://en.wikipedia.org/wiki/Technological_singularity
It looks as if that point in time has started to lap against our shores. It was fascinating to witness the "Flash Crash" first hand, which in my view has brought to the forefront the argument of man vs. machine. What hit home watching the CNBC coverage after the close of business on March 6th, 2010 was the rare interview with Mark Fisher, a trader of legend on the Chicago Mercantile Exchange, a super PIT Trader, a veritable John Henry character. Here warning of the dangers of relying on machines for trading. Lamenting the speed with which machines can trade at and the and the dire circumstances it will wreak on the markets, without the ability for humans to step in. This interview still in the heat of the moment was a poignant event.
We are clearly at a crossroads, the fundamental question being does having a human element interspersed with machines make it inherently more dangerous or does having a fully electronic marketplace make it less. Clearly a hybrid of an electronic/analog market is fraught with issues, just ask the heads of the NYSE and NASDAQ respectively who pointed at each other's platform as the culprit. '
The questions that have been asked and still at this point haven't been answered are
a. Is/Was the system design flawed?, b. Was it gamed? c. Is/Was this machine or human error, or both? d. Was it all of the above?
My guess is that the explanation will be a long time coming. It is likely that we will never know what happened for certain mainly because any one of these answers in and of itself is too unsettling when 10's of Trillion of Dollars is held and accounted for by a system that is either flawed in design or can be gamed. I'm guessing that we will never get the equivalent of the thorough NTSB investigation of a fatal airliner crash when it comes to these market scenarios. For instance, where is the "black box"? Granted even if we do learn what happened it will have come out many months when we've likely to have forgotten or the findings deemed obsolete. Theoretically, we should be able to roll back the tape pretty quickly and do an instant replay but I'm guessing that the platforms are reticent of offering this capability. I am a little worried because all the focus apparently is on the systems and the trades of that day, and doesn't appear to be including the scenario of market manipulation, and I am not insinuating anything I'm just saying it needs to be ruled out. I don't think that can happen if the SEC is focusing on just what happened that day instead of focusing on the days leading up to and several days after that point. We need to do that to eliminate or rule out that the system was gamed.
On the question is or was the system flawed? My guess is that it wasn't and that the system worked as designed however, no one had anticipated a breakdown that would literally run down to the point past the built in circuit breakers. When it was realized that this literally could have snowballed into a real 1,000+ point loss in the 90 minutes left of trading, that is if the NYSE left the control rods out, they instead opted to pushed them in.
A lot of people have been making this out to be a technical glitch, and the facts don't seem to bear this out. What the commentary has been alluding to was that there is one glaring weakness of machines, and that is its ability to determine a company or stocks relative value. The idea that a machine would sell a Procter & Gamble at $39 a share without being able to recognize that this price was clearly incorrect or that the value of the company fundamentally wouldn't support this price is something that needs to change or does it? I was thinking of a most recent example with Intermune which in two days went from $17 to $48 in two gap ups and then went from $43 to $9 in one gap down, it didn't seem to be a problem with machines recognizing value there, granting of course that trading was either halted or the run up took place pre-market. Dendreon is another one that also comes to mind when you discuss break necking prices in a stock "Flashes". If there are no buyers what price do you want to buy at?
What makes one "Flash Run" worse or better than another?
Here I thought Felix Salmon's article on Alpha Hedge, put it into perspective, that basically there was no difference from the Day of May 6th to this past May 20th Thursday when we went breathlessly towards the falsh crash low twice Intraday. http://seekingalpha.com/article/206223-the-weirdly-rational-flash-crash
What his simple but insightful research suggests is that the flash crash although very fast was rooted in fundamentals. There is only one conclusion that May 6th was a bona fide and legitimate rush for the exits and May 20th confirms this.
Is the possibility this "Flash Crash" was instigated for some reason if who or what is the benefit?
Personally I am of the opinion that the "flash crash" was caused by human hands and quite possibly deliberately, not criminally, but deliberately executed. For what motive? Well to basically enable an orderly exit by big institutions and block traders out of huge positions, and likely save the US markets and potentially economy from a likely catastrophic event. This is clearly selling that could have fed on itself and burned itself to the ground, in what can be described as a race to the bottom. There is a scene in the movie Days of Thunder when Cole Trickle, intentionally redlines and blows his engine so that he doesn't have to face the fact that he has lost his nerve, how is that for a visual.
This is akin to the problems we witnessed several years ago in the wildfire prone west, where in our effort to create awareness and eradicate wildfires we have created a 30-50 year fireless environment and due to our complacency and false sense of security chose to build homes closer to danger. The build up of decades of underbrush created maelstrom's that were devastatingly fast, all consuming and deadly. The stop orders accumulating underneath the market action were the underbrush, when triggered, acted as natures perfect accelerant. What the NYSE did in essence was a controlled burn, if the NYSE market makers hadn't slowed down there systems deliberately the fire would have burned significantly more acreage.
What was so amazing about the "Flash Crash" -- watching it unfold -- was the rumor of a fat finger trade was rampant no more than 30 seconds after it started/ended and that it was immediately picked up by all the news outlets particularly by CNBC, which really should have had the story straight from the get go because they have reporters on the floor of the exchange, and apparently were not aware that the market makers themselves redlined the engine so that it blew. This action immediately, caused the stop loss orders to be blown out and the standing buy orders sitting at 10-20% discounts of the current prices to trigger creating a massive swell of buying momentum that they could easily sell into without driving down the prices too quickly. This worked brilliantly over the next few days as the fat finger trade or pointing to the machines made it seem like an anomaly, and created seemingly good bargains to get into really quickly. That is until the Fat Finger turned into a fist slamming on the sell button.
The selling had started a couple of months before this episode, but really started to accelerate after the Goldman Top, in fact it looked as if the market was settling into a flag, when all heck broke loose a la flash crash, and the follow through the next day created a wonderful buying opportunity of the stock "bargains". The fact that the selling took place late in the first week of the month was pretty telling as well, as during this rally they have ended as bullish weeks, it has been the 3rd week which has been generally been bearish.
The selling continued into this "artificially" created demand for lower priced stocks, but the since supply is too great for the bulls to eat up and now as no real explanation has been forthcoming for the "Flash Crash" the more it appeared that the selling was real and highly motivated, the bulls got spooked. It is likely that the selling isn't over as we see the folks who bought into that early swell realize they just got their lunch eaten once again. They will likely get out this week if the market still struggles and bring us down to the next level of down. Or we will rally this week and trade in a range and wait for the first week in June. This should be a fun quarter end for everyone.
Has the technological singularity in the markets been achieved and were we there on Thursday? My hunch is no, but we are not far off. Do we need an all electronic market system? My personal conviction is a resounding Yes, the sooner the better. They may be steam shovels now, but we need fully transparent and accountable markets to fuel the next stage of our growth and this will not do. With the proper safe guards -- think Toyota spontaneous acceleration problem -- we can limit the impact of bad system design and code until such time we can overcome it.
We are just three years removed from Vernor Vinges prophecy and it isn't so farfetched that trader's will likely be replaced by machines and that the true ideal of a fast and equal market will result. Many systems are already processing news signals on stocks and acting on signals and world statistics and signals quicker than a human can, (Blackrock's Aladdin System, Goldman Sachs, JPM and Renaissance Technologies, just to name a few. The one thing that we need to be aware and scared of is human intervention or gaming. As this will maintain the status quo.
Here is an intraday, DOW 4500 quick update, 10,232.33 is now resistance, the bounce back from the 9,918.82 low (Which was below the flash crash low, indicating the downside isn't done yet) this morning is currently at 10,186.13, no wait 10174 uhh 10159.38... ok 10,175.15 (On Bama, DoDD and Frank) news conference.
This right shoulder has made a turn in 1/4 of the time it took to create the head and 1/10 the time it took for the left shoulder. If we blow through the February low which I am betting that we will by or in June. The next logical rest/rally point is 9,557.48-9,301.05.
Ugly yes I know... Worse are the comments WalMart has made about the outlook on their business. When WalMart is struggling it's time to take notice. Their customer's are hurting with unemployment, higher fuel prices and personal finances concerns. Hey well at least the weather is nice here in NY.
Starting around February of this year, February 4th, 2010 to be exact I became aware of the suddenly big stirrings in the Art market. This was precipitated by the sale of Swiss artist Alberto Giacometti's six-foot bronze sculpture called "Walking Man 1" which sold for then a world record price of over $104 million, that is until the $106.5MM Picasso two months later. This sculpture, was on the market, primarily due to the failure of Dresdner Bank and the bank's new owners looking to raise funds. I guess the one thing about this sale that was so remarkable to me was that this piece was only expected to fetch $28MM "at most" in auction, and that there were 10 bidders participating in bidding it up. Source: http://marketplace.publicradio.org/display/web/2010/02/04/am-art-market/.
This just lends more credibility to the assertion I made in my article "On The Token Economy" On Our Token Economy System about the abundance of M1,2 and 3 money being able to literally create bubbles virtually overnight.
The conventional wisdom at this time and currently is that this is a very Bullish signal indicating that the markets were back and wealth was being created again.
The art market says more about the real mood among the actors of the world economy than opinion polls, and the European Fine Art Fair is its most important reflection. Source: http://www.nytimes.com/2010/03/20/arts/20iht-melik20.html
This much maybe true, however, I am not buying into conventional wisdom that this is evidence that the markets are rebounding. Instead, I see this as a contrarian and worrying signal that the rebound in the Art market is a sign that it is worsening. Specifically, that the sudden uplift in demand for Art is being used as a hedge against over inflated assets, which ironically is overheating the Art market. Collectibles Cars, Art, Wines Architecturally significant structures are now all in vogue, and the money chasing these assets is enormous.
Of course in support of this being a bearish signal it matters a great deal about the art that is being coveted and most sought after, in this article it details the works of Old Master's and it is not just paint on a canvas. The idea that suddenly a great number of European art (largely Dollar denomindated..natch) is now on the market is signaling that possibly the picture in Europe is decidely more dire. The contemporary Art market is also strong as evidenced, by the recent sale of Picasso's painting of Marie-Thérèse Walter, Nude, Green Leaves and Bust for over $106m. However, in support of a widely recognized formula it is not just any contemporary art, as remarked upon here at the Blog "The Art Machine".http://theartmachine.wordpress.com/2010/05/08/art-market-recovery-tracing-improvements/
"First recoveries: Old Masters, 20th Century Decorative Arts
Old Masters are the last to fail, the least effected, and the first to rebound. The fusty, the academic, the tried and true, may bore the speculators and thrill seekers, but they are the best investment and a good early signifier of market growth. As I noted in an earlier piece about Banksy, the art market loves a good prank for sure, and mystery has worked well for street art, just as experimentation works well for contemporary art: but they don’t encourage confidence. Mystery = Uncertainty = Risky Investment.
Second recoveries: Rare Opportunity Buys
Why: Last Chance Appeal
Scarcity is always a driver. If your Picasso was painted in 1932 and there are only five 1932 Picassos and most of them are privately owned and not like to to be sold within your buyer’s lifetime, then your gaudy, nearly sentimental, middling painting becomes a “powerful memento of Picasso’s most famous lover” and goes for a record $106.5 million."
The shift in the type of Art being accumulated is also different. Here is what was being said about what was hot December 25th 2007, in this article "Boom times for the art market"
While art from all eras is selling well, works by modern masters like Warhol and Mark Rothko and living artists like Richard Prince and Damien Hirst are especially hot. In oil producing countries like the United Arab Emirates, the appetite is for modern American works by such artists as Keith Haring, Jean Michel Basquiat and Warhol, Peck said.
"The most money is chasing these modern and contemporary names, and that's just what's in fashion really," Peck said, adding that buyers with new money from Russia and China have a "limitless appetite for Western art and objects. Prices in some cases have doubled or tripled in the past year." Source: http://www.breitbart.com/article.php?id=D8TOKQJ80&show_article=1
Continuing on this theme of the Art Market bearish signal check out search terms on Google and the following links from November 2006 and December 2007, look/sound familiar? Look at the jump in search term "Art Market" on Google. One big spike at the end of 2006 a point where the market was thought to be at a top, and then a big lull to coincide with the additional leg up to the top in 2007, and then another spike coinciding with market dislocations in the equities, Spring 2007 the end of 2008 etc. etc. This lends even more credibility as to my assertion that the Art Market is a good signal for down turns or at least good times in the market, i.e. no searches = good times lots of searches = bad times.
I couldn't resist this comment... I expect this was prior to the Japan bubble deflating...
"Last time the art market was this hot, back in the '80s, demand was mostly being driven by one small group of collectors in Japan." David Norman is director of Impressionist and Modern Art at Sotheby's."Art Market On Fire", November 7, 2006 http://marketplace.publicradio.org/shows/2006/11/07/PM200611077.html
Remember Van Gogh's Sunflowers? It sold for a then record price of $40MM in March of 1987, and then on November 11th 1987, "Irises" sold for another record price for Art.
1987: Van Gogh fetches record price - A painting by Vincent Van Gogh has been sold for $49m (£27m) - a world record for a work of art. The final price was more than twice what the painting, called Irises, had been expected to reach. The anonymous purchaser must also pay a 10% commission fee to the auction house, Sotheby's, bringing the total to $53.9m (£29.5m). The sale was also accomplished in what may have been a record time given the figures involved - the bidding rose from the starting point of $15m (£8.5m) to reach the final sale price in less than two minutes. http://news.bbc.co.uk/onthisday/hi/dates/stories/november/11/newsid_2539000/2539613.stm
Caution, we are again at world record level Art prices, this is the smart money trade.
"FOURTH QUARTER INCREASE OF 13.1% REVERSES ART MARKET SWOON BUT IS INSUFFICIENT TO AVERT A DECREASE OF 23.5% FOR THE YEAR IN THE MEI MOSES®ALL ART INDEX
The 2009 decrease in the return of the Mei Moses® All Art index of approximately 23.5 percent is the largest decline in the all art index since the 1991 decline of 38.7 percent. The 38.7% decline occurred after the bursting of the last art bubble of 1985-1990. The 23.5% was also the second largest decline since the great depression. The declines of 2008 and 2009 occurred after five years of positive annual growth averaging almost 20 percent. The 2009 decline of the all art index was particularly depressing given the substantial increase of most other financial assets" Source: http://www.artasanasset.com/market/
Admittedly, I am no art critic or historian, but I can appreciate it and do enjoy taking a day trip to the art museum, and make it a point when traveling to stop at the more significant museums in the countries I've visited. I also noticed with mild astonishment at the quality and abundance of -- in my own non-expert opinion -- high quality art being readily and prominently displayed in many Hedge Fund and Hedge Fund of Fund offices I have had the privilege of visiting. A veiled reminder that its function is both beauty (of course, in the eye of the beholder) as well as an asset (in the eye of a collector/investor).
"At the presentation of "Art, a Resilient Asset Class" this week at London's Haunch of Venison Gallery, a panel of experts including Hoffman discussed the art market's upward trajectory.
The panel, chaired by Scott Reyburn, art writer for Bloomberg, comprised of Hoffman, Oliver Barker, head of contemporary art at auction house Sotheby's, Karen Sanig, head of art law at Mischon de Reya Solicitors, and Anders Pettersen, founder of information provider ArtTactic, and Dennis Lavin CEO of wealth manager Vistra in Jersey.
Sanig added that the art market had proved itself relatively uncorrelated to the financial market, having bounced back within 18 months to new highs and several new records, partly due to the perception of art as a safe, tangible haven for wealth.
New York auction results posted by the big auction houses in this month were a far cry from those posted in May 2009, a sign that a large number of major collectors are "clearly back in acquisitive mode", according to Thierry Erbmann, founder of information provider Artprice.
At the end of the Impressionist and Modern Art sales between 4 - 5 May, Christie’s and Sotheby’s posted a combined revenue up 205% compared with the previous year’s total. Their combined results from the Contemporary Art sales in May were nearly 230% better than the previous year.
The bought-in rates were particularly low ranging from 6% to 22%, and twelve new records were set.
Art is definately one of the two currencies for the cash n' carry trade -- although it might be tough to tuck Walking Man 1 under your arm without being conspicous --, the other one being fine jewelry (not Gold) see Harry Winston, Bulgari and Tiffany. As Barton Biggs, wrote in Hedge Hogging, as quoted from "The General" "Paper Assets are fine and wonderful things in normal times, he said but they are useless when anarchy reigns". Barton goes on to explain that "Disaster hedges must be highly portable, easily hidden and very marketable". Apparently at least one thief read Hedge Hogging and took Mr. Biggs advice to heart, having "made off" -- no pun intended --with paintings valued as approximately €500MM Euros ($600MM USD) from the Paris Museum or Modern Art. The paintings were "Le pigeon aux petits-pois" (The Pigeon with the Peas) by Pablo Picasso, "Pastoral" by Henri Matisse, "Olive Tree near Estaque" by Georges Braque, "Woman with a Fan" by Amedeo Modigliani and "Still Life with Chandeliers" by Fernand Léger. Source: http://www.wealth-bulletin.com/rich-life/rich-monitor/content/4063139733/
Maybe Greece isn't Lehman, perhaps it is the Bear Stearns subprime hedge funds in the Summer of "2007" or Bear Stearns itself in Spring "2008", i.e.. the canary in the coal mine, but as often the canary usually is the first casualty in this case they managed to get it to the vet on time. However, one thing for sure if Greece and Thailand (add live TV shots of anarchy in the streets) are foreshadowing what is likely to come it only makes sense that Art would be a most sought after, disaster hedge. WT
Melanie Clore, co-chairman, Sotheby’s Impressionist and Modern art department said: “At a time when there is such enormous demand for museum quality paintings by the Impressionist masters, it is exciting to be able to bring this extremely rare painting to auction." Source: http://www.wealth-bulletin.com/portfolio/alternatives/content/4058787079/

 Posts
Posts


 AFP/Getty Images